Manual Dashboard Review
Use this guide when the right decision depends on human judgment: a suspicious contig needs visual context, a breakpoint should be staged from a plot, or a curated FASTA needs an explicit recipe.
The key question is:
What should I decide in the browser, and what should I reproduce from the command line?
The Core Idea
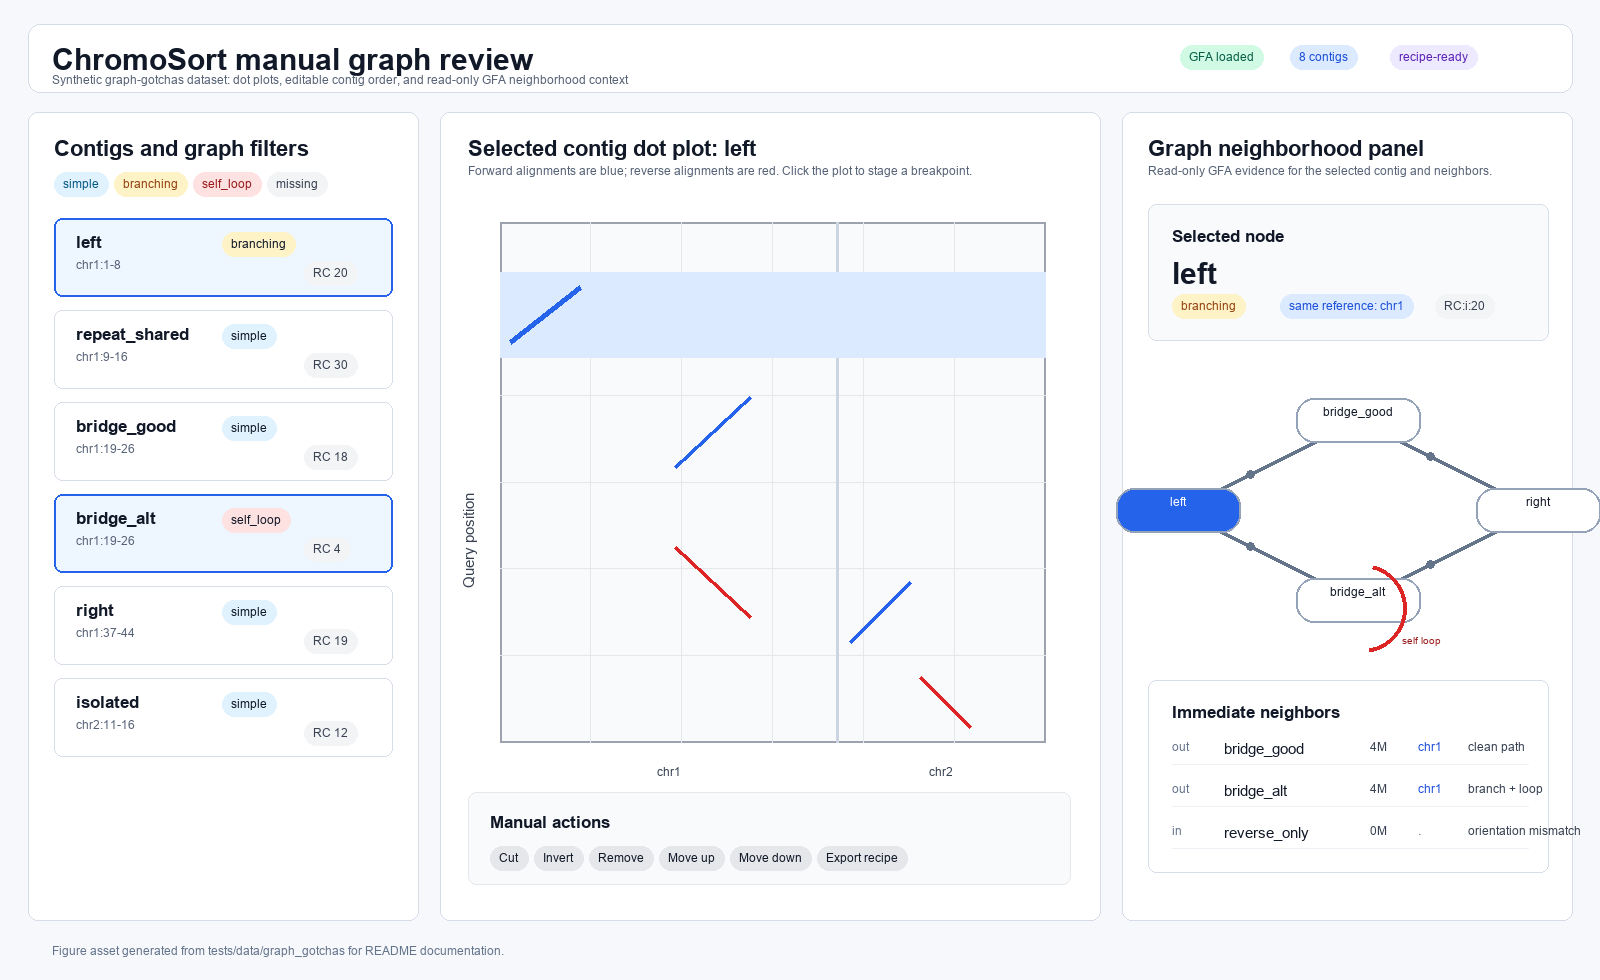
chromo manual is a review surface, not a hidden automatic fixer. It creates a
self-contained HTML dashboard where you can inspect dot plots, optional graph
context, and optional chromo eval review events beside the contigs or
junctions they describe.
The dashboard can export a FASTA directly from the browser, but the more
reproducible path is to export a recipe JSON and apply it with
chromo manual apply. That turns browser choices into an audited command-line
FASTA and optional TSV report.
What The Dashboard Reads Or Writes
chromo manual reads:
- reference FASTA,
- assembly FASTA,
- one coords or PAF file for that exact FASTA pair,
- optional GFA graph context,
- optional long-read PAF or GAF evidence,
- optional
chromo evalreview table for task-specific queues.
It writes:
- one self-contained HTML dashboard,
- a browser FASTA download when sequences are available,
- a browser recipe JSON download,
- a reproducible FASTA and report when the recipe is applied with
chromo manual apply.
The dashboard dot plots still come from the original coords or PAF file. After
manual export or manual apply, re-align the manual FASTA before using it as
the assembly input to chromo sort, chromo plot, chromo scaffold, or other
alignment-dependent steps.
Dashboard Modes
| Mode | Use it when… | Extra review focus |
|---|---|---|
chromo manual |
You want free-form browsing and curation. | Contig list, dot plots, graph context, breakpoints, removals, inversions, scaffold labels. |
chromo manual fix |
You have a fix_review.tsv from chromo eval fix. |
Candidate split-piece queue and breakpoint evidence panels. |
chromo manual scaffold |
You have a scaffold_review.tsv from chromo eval scaffold. |
Adjacent scaffold-junction queue and gap/overlap evidence. |
chromo manual gapfill |
You have a gapfill_review.tsv from chromo eval gapfill. |
Graph fill queue and path-support evidence. |
Task-specific manual dashboards do not replace the reviewed executor. They make review easier, then the accepted table or exported recipe still has to be applied explicitly.
What To Inspect First
Start with the left-to-right review path:
- Confirm the dashboard was generated from the intended reference, assembly, and coords or PAF file.
- Select a contig or review event.
- Compare the dot plot to the assignment, breakpoint, scaffold, or gapfill table row.
- Check optional graph, GAF, or long-read evidence panels when available.
- Stage only the edits that match the evidence.
- Export a recipe JSON for reproducibility.
- Apply the recipe from the command line and save the report beside the FASTA.
Common Manual Actions
| Action | Good use | Watch out for |
|---|---|---|
| Remove or restore a contig | Exclude unplaced, redundant, or clearly unwanted records. | Do not remove possible haplotypes or real duplications just because they overlap a reference span. |
| Move a contig or piece | Correct a reviewed order within a scaffold group. | Re-check the output with fresh alignment after export. |
| Invert a piece | Make a curated output match the reviewed orientation goal. | Whole-contig reverse orientation is often a normal sort option; internal inversions need evidence. |
| Add a breakpoint | Split a visually reviewed region. | Browser-staged coordinates should be reproduced with a recipe and audited in the apply report. |
| Label scaffolds | Group active pieces for scaffold export. | Use clear labels that match downstream naming conventions. |
| Remove unaligned | Quickly exclude records without current placement evidence. | Confirm whether unaligned sequence is expected, novel, or a name/alignment problem. |
Free-Form Review Workflow
Generate a dashboard:
chromo manual \
  --ref-fasta reference.fa \
  --assembly-fasta assembly.fa \
  --paf paf/sample.paf \
  --gfa assembly_graph.gfa \
  --output-html review/sample.manual.html \
  --suggested-output-fasta sample.manual.fa
For large genomes, the HTML embeds metadata but not full assembly sequence by
default. Open the dashboard, load the original assembly FASTA with the browser
file picker, then export the FASTA or recipe. For small demos, add
--embed-sequences.
Apply the recipe:
chromo manual apply \
  --assembly-fasta assembly.fa \
  --recipe chromosort.manual.recipe.json \
  --output-fasta results/sample.manual.fa \
  --report results/sample.manual.tsv
Then re-align:
results/sample.manual.fa
  -> minimap2 or MUMmer
  -> validation plots and downstream sorting
Task-Specific Review Workflow
Use this pattern when an algorithm should propose rows and a human should review the outliers:
chromo eval fix \
  --assembly-fasta assembly.fa \
  --paf paf/sample.paf \
  --all \
  --gfa assembly_graph.gfa \
  --read-paf reads_to_assembly.paf \
  --gaf reads_to_graph.gaf \
  --output-prefix review/sample.eval_fix

chromo manual fix \
  --ref-fasta reference.fa \
  --assembly-fasta assembly.fa \
  --paf paf/sample.paf \
  --review-table review/sample.eval_fix.fix_review.tsv \
  --gfa assembly_graph.gfa \
  --read-paf reads_to_assembly.paf \
  --gaf reads_to_graph.gaf \
  --output-html review/sample.manual_fix.html
The same structure works for manual scaffold and manual gapfill with the
matching review tables.
Recipe And Report Audit
Read the manual apply report before trusting the FASTA:
| Field | Why it matters |
|---|---|
piece_id |
Identifies the reviewed browser piece. |
source |
Records the original assembly contig. |
output_name |
Shows the FASTA record emitted by apply. |
scaffold |
Shows the browser scaffold label used for export. |
slice_start and slice_end |
Audit the source interval. |
strand |
Shows whether the piece was inverted. |
removed |
Confirms records intentionally excluded from output. |
export_mode |
Distinguishes piece output from scaffolded output. |
Keep the HTML, recipe JSON, apply report, and manual FASTA together. They are the provenance bundle for the reviewed edit.
Cheat Sheet
| If you need… | Use… |
|---|---|
| Visual review without sequence changes | chromo manual dashboard only. |
| A reproducible manual FASTA | Export recipe JSON, then chromo manual apply. |
| A spreadsheet queue in the browser | chromo eval, then task-specific chromo manual. |
| A browser FASTA for quick inspection | Browser export, then still re-align before downstream use. |
| Evidence panels for GFA, GAF, or reads | Provide those inputs when generating the dashboard. |
Common Traps
Do not forget that the dashboard plot uses old alignment rows. Manual FASTA exports need fresh alignments.
Do not rely only on a browser download for provenance. Export and apply a recipe when the edit needs to be reproducible.
Do not assume a task-specific manual dashboard applies accepted rows. The matching executor still has to run.
Do not edit around a stale review table. Regenerate eval tables after changing the FASTA, assignments, graph, path-search settings, or primary alignment.
Do not treat graph and read panels as automatic sequence-changing authority. They are evidence for review.
What To Look At Next In ChromoSort
- Use Spreadsheet Review Tables
for
chromo evalaccept/reject workflows. - Use Chimeric Contig And Breakpoint Review before staging split edits.
- Use Inversions And Orientation Changes before inverting or normalizing internal orientation changes.
- Use chromo manual for the full command reference.