chromo plot
Use chromo plot when you already have a MUMmer coords or minimap2 PAF file
and want a visual check without running mummerplot or re-aligning only for
the plot. It writes PDF by default and can also write SVG or PNG. Forward-strand
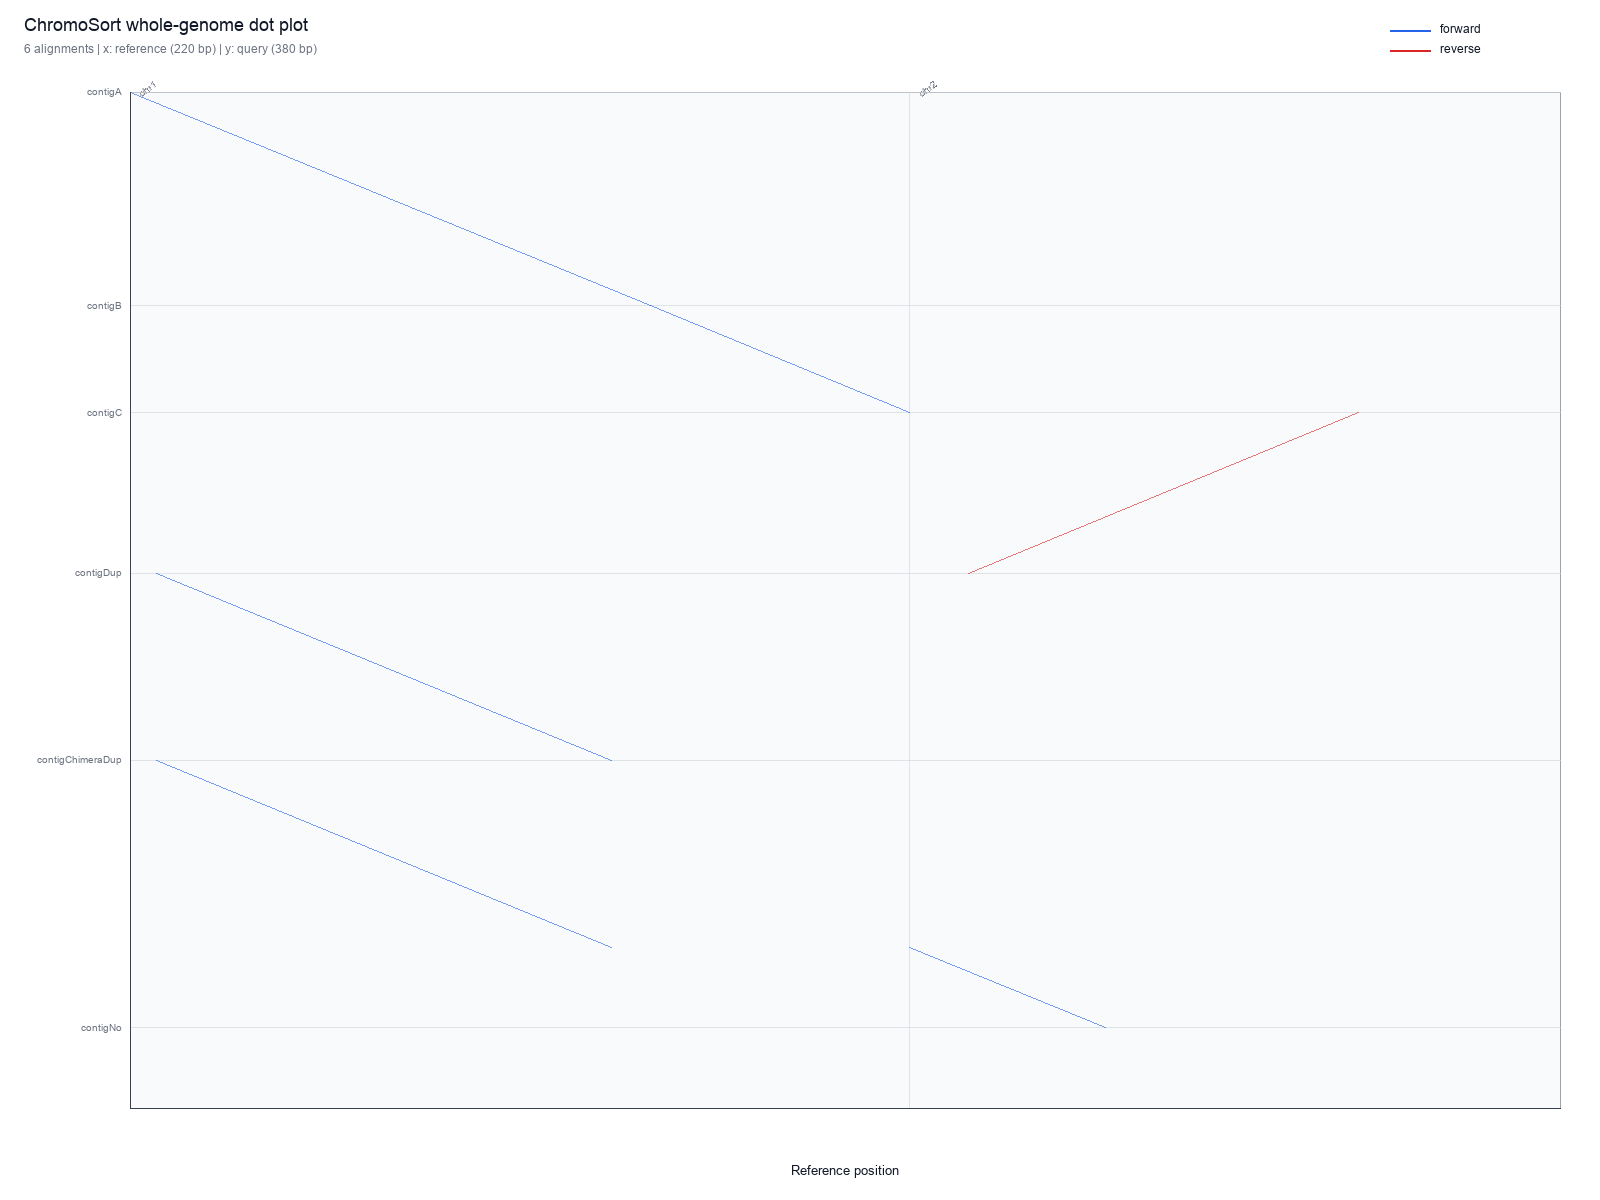
alignments are blue and reverse-strand alignments are red.
If you are learning how to read those patterns, start with How to Interpret Dot Plots. It explains axis orientation, forward and reverse segments, chimeric-looking contigs, inversions, duplicate or repeat-like signal, gaps, and common traps.
chromo plot never runs MUMmer or minimap2. It draws the alignment rows you
give it. If those rows were generated from raw.fa, the plot still describes
raw.fa, even when you also provide a chromo sort assignment report. The
assignment report can reorder the query axis by kept sorted contigs, but it does
not make a new alignment of <prefix>.ordered.fa.
After any FASTA-changing step, such as chromo sort outputting
ordered.fa, chromo clean outputting clean.fa, chromo fix outputting
fixed.fa, chromo cut, chromo manual export, or chromo scaffold, re-run
MUMmer or minimap2 before using
chromo plot to validate that changed FASTA.
Run chromo plot
Whole-genome plot from MUMmer coords:
chromo plot \
  --ref-fasta reference.fa \
  --assembly-fasta assembly.fa \
  --coords mummer/sample.coords \
  --output-prefix plots/sample
This writes plots/sample.pdf.
Whole-genome and per-reference plots from PAF, ordered by a chromo sort
assignment report:
chromo plot \
  --ref-fasta reference.fa \
  --assembly-fasta assembly.fa \
  --paf paf/sample.paf \
  --assignments results/sample.contig_assignments.tsv \
  --output-prefix plots/sample \
  --per-ref \
  --sel-ref Gm6 Gm12 Gm15 \
  --formats pdf svg
When --assignments is provided, the query axis is ordered by the kept contigs
in the assignment report. This is useful for reviewing a sorted ChromoSort
order from the same alignment file that powered the sort. It is not equivalent
to plotting the ordered.fa output; align ordered.fa separately if you want
the plot to reflect the edited FASTA records.
Per-reference plots keep the x-axis on the full selected reference sequence,
but compact each query row to the merged query coordinate spans covered by
alignments to that selected reference. This keeps multi-reference contigs and
large unaligned query gaps from adding unrelated vertical whitespace to each
--per-ref panel. Axis tick units scale with the plotted length, using bp, kb,
Mb, or Gb as appropriate for the current panel.
Use --sel-ref when you only want to replot one or a few reference sequences.
For example, --sel-ref Gm6 Gm12 Gm15 limits the main plot to those reference
sequences and, with --per-ref, writes only those per-reference panels.
chromo plot Outputs
| Output | Description |
|---|---|
<prefix>.pdf |
Whole-genome PDF dot plot by default. |
<prefix>.svg |
Whole-genome SVG dot plot when --formats svg is set. |
<prefix>.png |
Whole-genome PNG dot plot when --formats png is set. |
<prefix>.<ref>.<format> |
Per-reference plots when --per-ref is set; restricted to selected references when --sel-ref is also set. |
Example chromo plot Output
Table 1. Example plot file set. A single run can write a whole-genome plot
and, with --per-ref, one plot per reference sequence in each requested format.
| Output path | Meaning |
|---|---|
plots/sample.pdf |
Whole-genome PDF dot plot. |
plots/sample.svg |
Whole-genome SVG dot plot from the same alignment rows. |
plots/sample.chr1.svg |
Per-reference SVG for chr1. |
plots/sample.chr2.svg |
Per-reference SVG for chr2. |
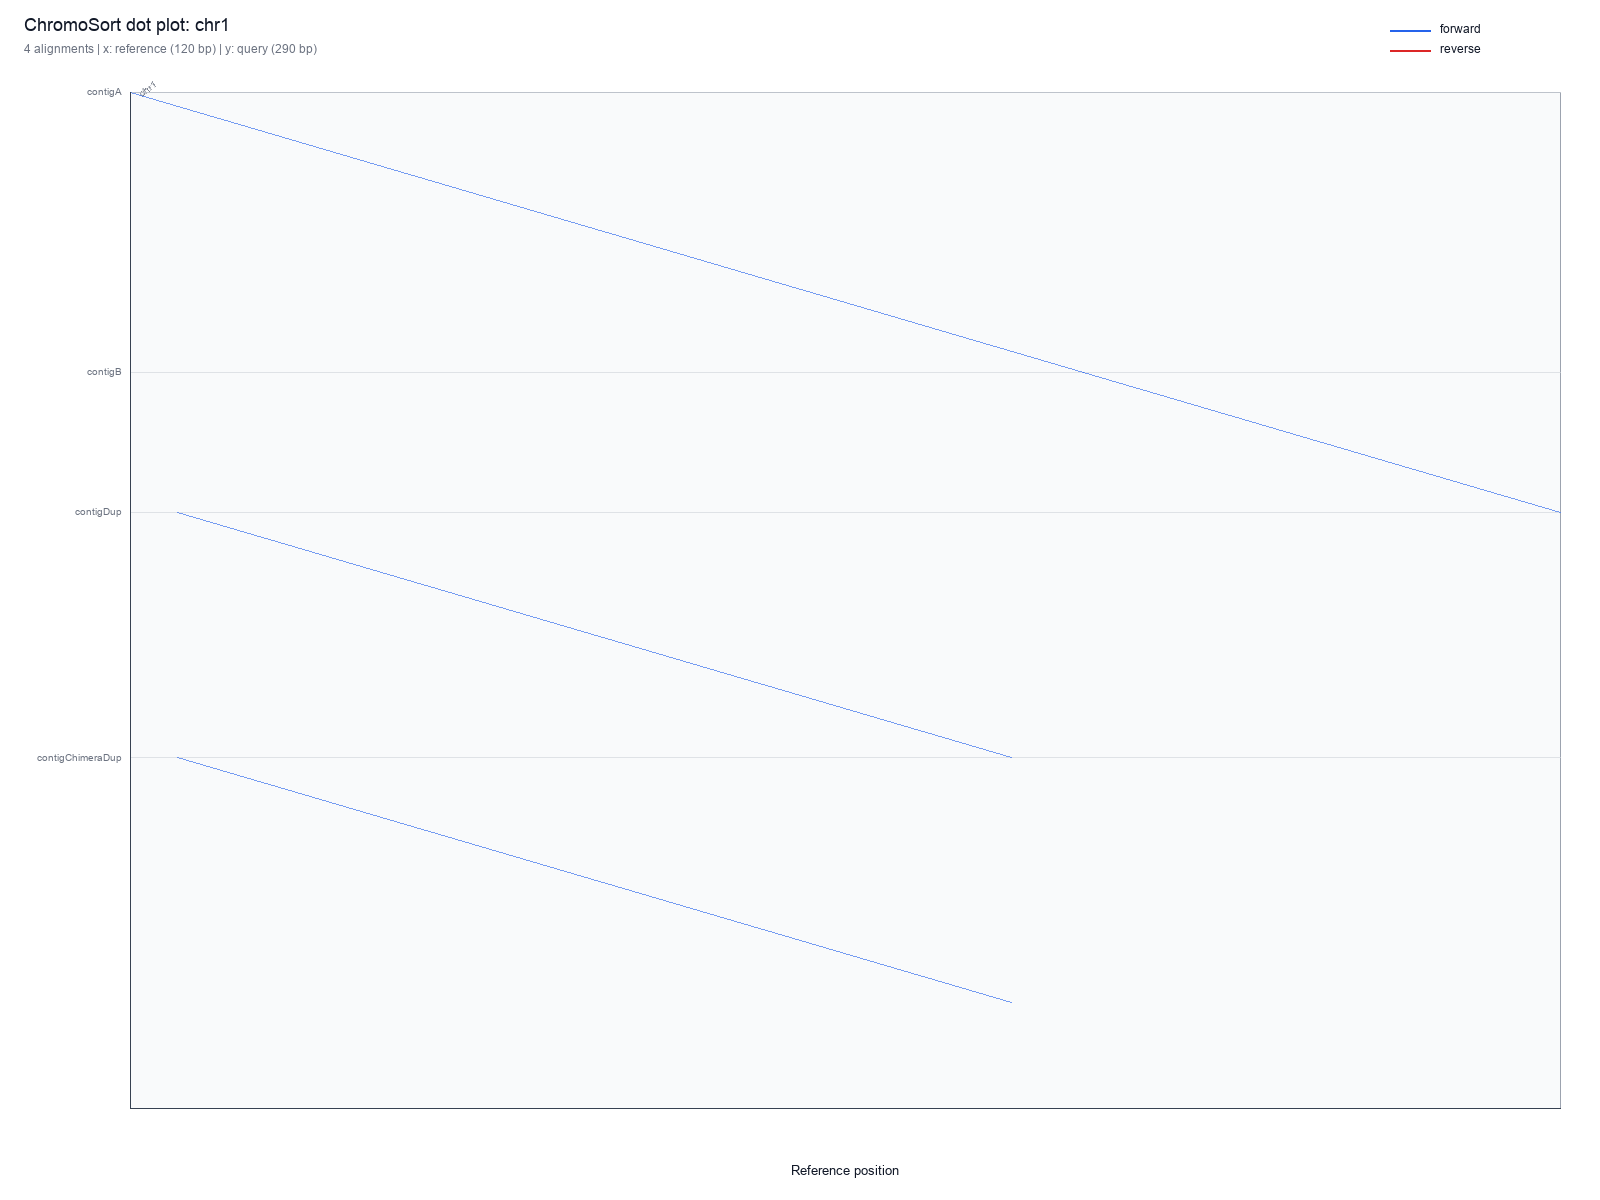
chr1 generated with --per-ref, useful for inspecting one chromosome-level slice without re-running an aligner.chromo plot Parameters
| Parameter | Default | Meaning |
|---|---|---|
--coords |
required unless --paf |
MUMmer show-coords alignment file. |
--paf |
required unless --coords |
minimap2 PAF alignment file. |
--formats |
pdf |
One or more output formats: pdf, svg, png. |
--assignments |
none | Optional chromo sort assignment report for ordering the query axis by kept sorted contigs. |
--per-ref |
off | Also write one plot per reference sequence with plotted alignments. |
--sel-ref |
none | Limit the main plot and --per-ref output to one or more reference IDs, such as --sel-ref Gm6 Gm12 Gm15. |
--per-ref-query-order |
fasta |
Use FASTA order or first reference-hit order for per-reference query axes. |
--min-segment-bp |
0 |
Minimum query-aligned bp for a row to be drawn. |
--min-segment-idy |
0.0 |
Ignore individual alignment rows below this percent identity. |
--min-mapq |
0 |
Ignore PAF rows below this MAPQ. Ignored for coords. |
--include-secondary-paf |
off | Include PAF rows marked tp:A:S; skipped by default. |
--max-segments |
0 |
Maximum drawn alignment rows after filtering; 0 means no limit. |